Mastering the Facebook Ads Reporting Tool: How to Build Custom Reports
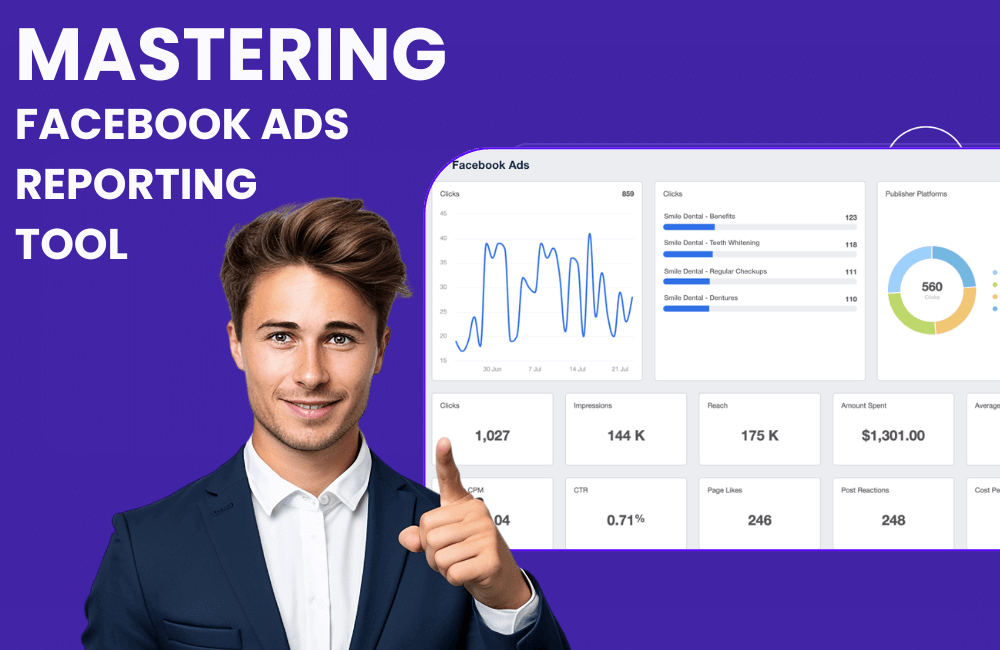
If you have ever run ads on Facebook, Google, or any other advertising platform, you surely understand the feeling of spending hours creating reports and dealing with complex spreadsheets. As a small business owner specializing in running Facebook ads for clients, we frequently receive requests to review campaign results so they can see exactly how their ads are performing.
Creating reports can be quite easy if you are familiar with the Facebook Ads Manager, but for beginners, this process can sometimes be time-consuming, especially when having to export data or manually compile it. In this article, BlackHatWorld will guide you on how to use the Facebook ad reporting tool effectively, helping you save time and present data more clearly and professionally.
Facebook Ads Reports
We understand that facing thousands of data rows can be overwhelming for you, especially when starting. Merely looking at isolated numbers does not tell the full story behind a campaign. Therefore, systematic data analysis is an extremely crucial factor. To support this, Facebook has integrated a highly powerful tool: the “reports” feature in Facebook Ads Manager. This tool allows advertisers like us to easily analyze, compare, and visualize data with just a few simple steps.
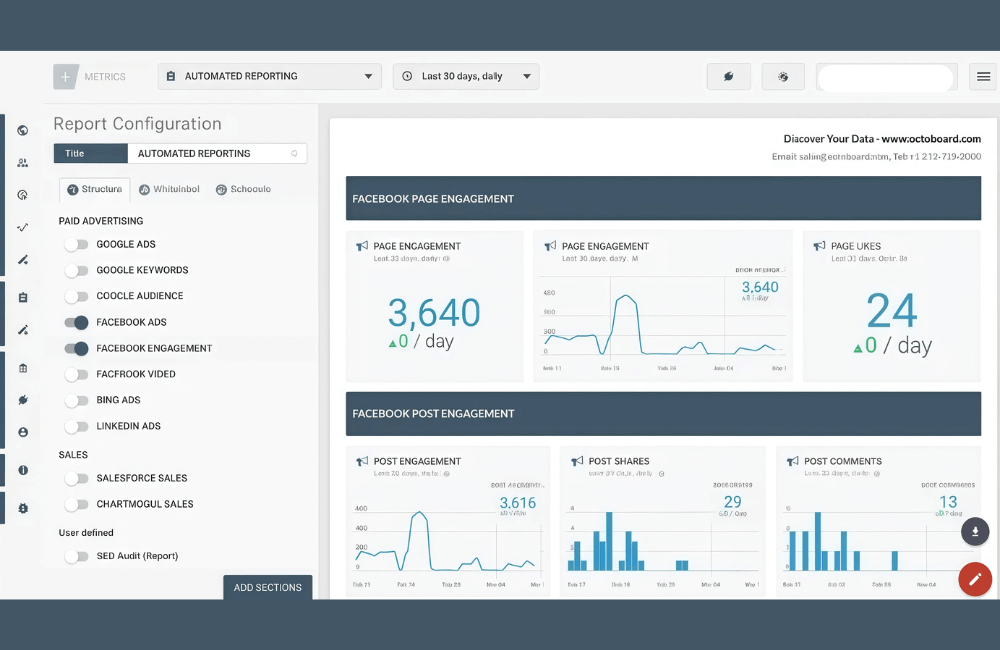
Specifically, Facebook Ads Reports help you download data in various formats, such as Excel (.xls) or CSV, for more detailed analysis. You can also customize how the data is displayed from multiple perspectives: by campaign, ad set, ad, time, placement, or target audience. For instance, if you want to know which campaign delivered the highest performance last week, you only need to select the filter by “Time” and “Campaign” to view the results immediately.
Facebook has designed a user-friendly interface for the Reports section, enabling users to perform tasks intuitively without the need for deep data analysis skills. Once you have created the appropriate report, you can export or download it to share with your team or clients. This not only saves time but also brings professionalism to the process of managing and evaluating ad campaigns.
Important metrics in a Facebook Ads Report
When you or advertisers execute campaigns on Facebook, understanding the metrics in the ad report is essential for evaluating performance, optimizing the budget, and making sound strategic decisions.
Breakdowns
Facebook provides us with various ways to break down data to customize the display of information in the report. You can flexibly choose according to your analytical goals.
Level
Advertisers can view data by Campaign, Ad Set Name, or Ad Name.
For example, if you are running three different campaigns for three products, you can view the report at the campaign level to evaluate overall effectiveness, or narrow down to the ad set level to see which ad set is driving the most conversions.
Time
You can analyze data by day, week, biweekly, or month to capture the activity trends of the campaign in each period. For instance, if you notice a low click-through rate (CTR) toward the end of the month, that might signal a need to re-optimize the content or change the target audience.
Demographic information
Hạng mục này cho phép xem dữ liệu theo độ tuổi, giới tính, hoặc kết hợp cả hai, cùng với đối tượng tùy chỉnh.
This category allows you to view data by age, gender, or a combination of both, along with custom audiences. For example, if you find that the female group aged 25–34 accounts for 60% of purchases, you can focus your ad budget on this group to increase revenue.
Geography
Data can be segmented by country, region, DMA region, or Comscore Market. This is very useful when you want to know where the ad is performing most effectively. For example, if you run a nationwide ad but notice that the majority of conversions come from Ho Chi Minh City, you can adjust the campaign to focus more on that region.
When refining the report to display geographical information, the data will reflect the location where viewers saw the ad or where they live, depending on how you set up location targeting in the campaign.
Delivery
In this section, you can view data by Ad placement, platform, time of day (based on account or viewer time zone), impression device, or media file type.
Example: if you find that video ads perform better on Instagram reels compared to Facebook feed, you can increase the budget for that platform to maximize effectiveness.
Note: For off-site conversions, Facebook only provides breakdown metrics such as impression device, platform, and device, and ad placement.
Action
This section helps you analyze user actions driven by the ad more deeply, such as conversion device, video view type, or video sound setting (on/off).
Example: if the majority of your video viewers do not have sound turned on, you should add subtitles to improve the delivery of your message.
Note: Facebook currently only supports breakdown metrics for offsite conversions within the iOS app or on the website with 9 main metrics: age, gender, age and gender, country, impression device, platform, platform and device, ad placement, and audience.
Metrics
After choosing how to break down the data, you can select specific metrics to evaluate campaign effectiveness.
- Performance: Includes metrics such as reach, impressions, and delivery, helping you evaluate the scope and frequency of ad display.
- Engagement: Indicates the viewer’s interest level through page engagements, photo views, post saves… For example, if a post has a high engagement rate but low conversions, you might consider changing the call-to-action (CTA) or the destination link.
- Conversions: Includes metrics such as add-to-carts, adds payment info, or donations – particularly important if your goal is sales or fundraising.
- Settings: Helps advertisers track the objective, ad set budget, and campaign budget, thereby ensuring the campaign operates according to its initial direction.
Filters
In Facebook ad reports, the data filtering feature works similarly to the ads manager. By default, Facebook will display ads that have been delivered and have at least one impression. However, you can completely customize the filter to focus on the elements you want, such as:
Only showing campaigns that have achieved over 100 conversions.
- Only showing campaigns that have achieved over 100 conversions.
- Filtering active ads within a specific time period.
- Or removing campaigns that have not yielded expected results.
As a result, we and you can easily perform deeper analysis, derive valuable insights, and adjust the advertising strategy more accurately and time-efficiently.
A guide to Creating and Exporting campaign reports in Facebook Ads Manager.
To begin, go to the Ads Reporting section in the main menu. If you do not see this section, simply select All Tools → Analyze and Report → Ads Reporting.
When the reporting interface opens, you may see previously saved reports. To create a new report, follow these steps:
- Click Create New Report.
- Select the report type you want, for example, “Trends” if you want to display a time-based trend chart.
- Name the report, for instance: “Demo Report – Real Estate Campaign”
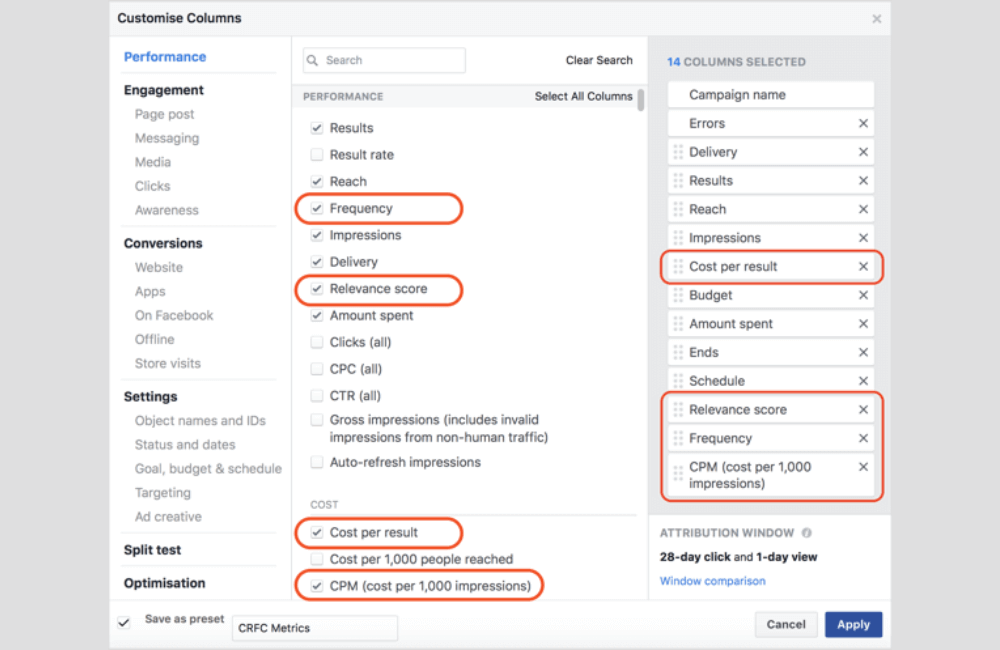
- In the right column, you will see a list of metrics (columns) – which can be customized by adding or deleting columns such as Campaign Name, Ad Set Name, CTR, CPC, Cost per Result, Impressions, Reach, etc.
- Use the search box to quickly add metrics, for example, enter “Click-through rate” to add the CTR metric.
- If you need to filter data, filter by campaign, ad set, or specific ad. For example, you only want to view campaigns with the “FB” designation to separately track Facebook ad performance.
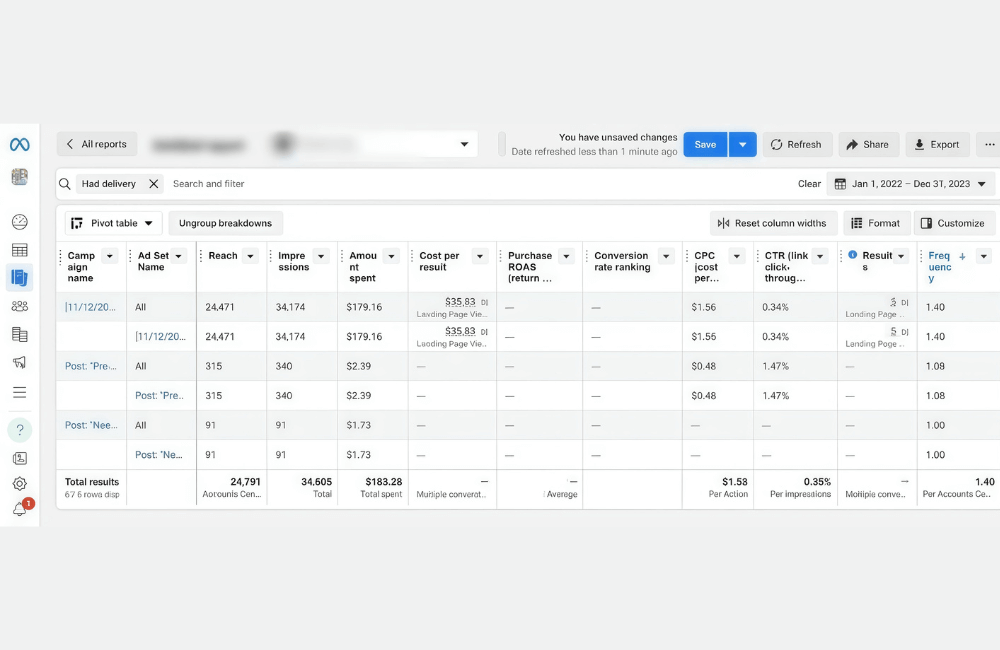
After finalizing, you can view basic metrics such as:
- Reach: The number of people reached by the ad.
- Impressions: The number of times the ad was displayed.
- Frequency: The average display frequency.
- Results / Clicks: The number of results or clicks.
- CPC (cost per click): The cost for each click.
- CTR (click-through rate): The click-through percentage.
When the report is complete, click Save to create a report template. In subsequent times, you only need to change the data display period, and the system will automatically update the new figures without needing to recreate them from scratch.
How to share and export reports.
After finalizing the report, you can share it with clients or teammates in two ways:
- Share a direct link: The recipient needs a Facebook Business Manager account to access and view the data.
- Export file: Select the desired format, such as Excel (.XLS), CSV, or PNG (image) to download and send to the client.
If you want to show an additional summary section, you can enable the “Include summary row” option to add a descriptive header row and explain each data column – making it easier for clients to understand when reading the report.
Mastering the Facebook Ads Reporting Tool: How to Build Custom Reports
Start directly on the familiar Facebook Ads Manager interface. This is the central tool that most advertisers use to manage campaigns.
We currently have an active campaign for a client in the real estate sector. In this account, we run various types of campaigns such as video ads, static image ads, and carousel ads (multiple images) to test the effectiveness of each content type. To save time when updating results for the client, we often create pre-made report templates. When a weekly or monthly report needs to be sent, we just reopen the saved template, update the time frame, and export the data – it’s very quick and convenient.
Typically, in the “columns” section of Ads Manager, the default view is performance, but we often switch to performance and clicks to get a more comprehensive overview.
Since this client focuses on increasing landing page visits with a sign-up form, the main goal of the campaign is lead generation. Therefore, we pay special attention to metrics such as reach, frequency, CTR (click-through rate), cost per result, and, for video ads, we also add the number of views and the average watch time to provide data for the lead generation ad testing tool.
In the upper right corner of the screen, you can select the time range for data display, such as 7 days, 30 days, or customize it according to the campaign phase. In this case, we are managing 3 separate campaigns, segmented by Facebook and Instagram platforms for easier budget control and effectiveness monitoring.
Mastering the ad reporting tool on Facebook not only helps us save time but also enhances professionalism when working with clients. By knowing how to create and customize appropriate reports, advertisers can quickly grasp campaign performance, optimize budget, and make more accurate decisions during each phase.
Frequently asked questions
Yes. Facebook ads manager allows you to save and manage multiple separate report templates, making them easy to reuse for different clients or campaign types.
Yes. When you reopen a saved report template and select a new time frame, Facebook will automatically update the latest data corresponding to that period, without the need to recreate the report from scratch.
💬 Contact now for free consultation from BHW!
- Website: https://vi.blackhatworld.io/
- Telegram: @bhw_agency
- Whatsapp: +84819001811
- Wechat: bhwagency
- Email: [email protected]
This article is also available in other languages: