Facebook Ads Measurements: 10 Key Metrics Every Marketer Should Watch
One of the vital skills for any advertiser on Meta is the ability to read and interpret data accurately. When you examine the key figures, every optimization decision becomes clear and evidence-based, rather than being based on emotion or guesswork. The problem is that the Meta advertising system has too many metrics, and not every metric is actually worth your daily attention.
In this article, BlackHatWorld will help you eliminate noise, manage ads professionally, and master how to measure Facebook ads through 10 key metrics that every Facebook marketer needs to monitor regularly to optimize ad effectiveness and increase ROI sustainably.
Facebook Ads Measurements: 10 Key Metrics Every Marketer Should Watch
First, open Ads Manager and look at the overview from left to right. We always keep the basic columns on the left side, so we never miss the most important information. In the far left column, there is a campaign on/off button, followed by the campaign name and delivery status. These are the things we always check first to ensure the campaign is running exactly as desired.
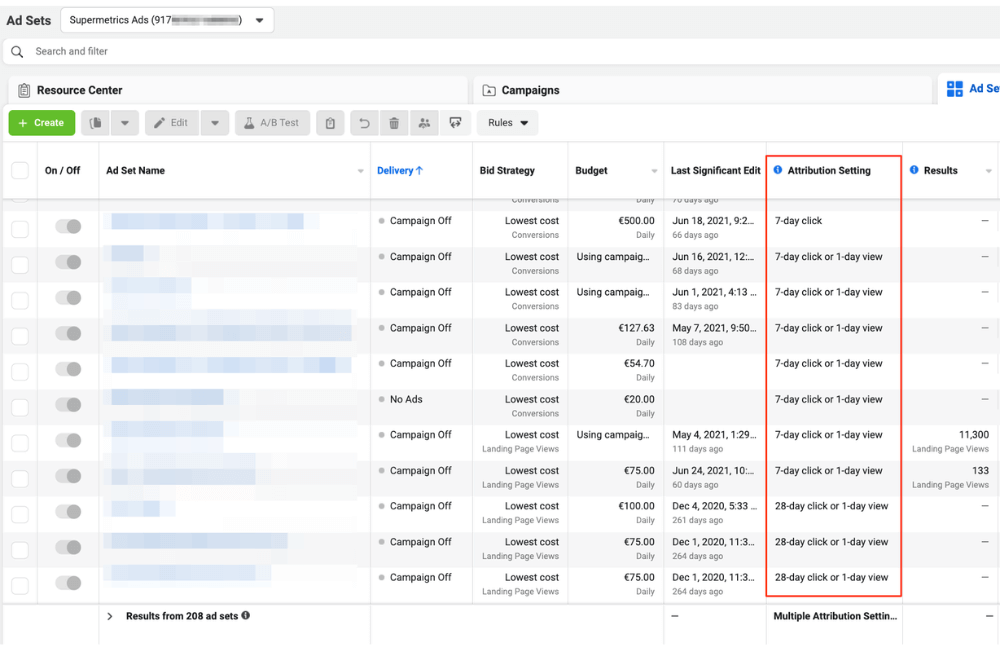
Another column that we always display is attribution. Most of the time, we use 7-day click and 1-day view. However, in some specific cases, for example, when seeing that Meta is distributing too much to people who already have purchase intent, we will turn off 1-day view so the data reflects ad effectiveness more accurately. This is a small adjustment, but it has a huge impact on how you read ROAS. Budget is also an indispensable column. Looking here, you know immediately how much each campaign or ad set is spending per day, which is especially important when you run CBO or are scaling the budget.
Amount Spent
This is the first metric and also the one we always place in the easiest position to see. When analyzing performance, we always sort data by Amount Spent from high to low. The reason is simple: the campaign spending the most money is the campaign Meta trusts the most. If that campaign spends a lot of money and has a good ROAS, you have a very healthy setup. Conversely, if the campaign spends a lot but has poor results, it is a red flag that needs immediate handling. For example, in an ecommerce account, a campaign spending 6,000 dollars that generates the majority of revenue will be worth prioritizing to analyze before campaigns that only spend a few hundred dollars.
Results
The results column displays exactly the action you are optimizing for. If the campaign optimizes for purchase, then the results will be the number of orders. If optimizing for lead, it will be the number of leads, and if running Traffic, it will be visits. The important thing here is not to compare Results between Campaigns with different objectives. For instance, a follower growth campaign may have many results but not bring in direct revenue. We usually use these campaigns with a small budget and only view them as support for the main funnel.
Cost per Result
This metric shows how much you are paying for a desired action. For e-commerce, it is usually the cost per order. For leadgen, it is the cost per qualified lead. For example, if you see a cost per purchase of 35 dollars while the AOV is 120 dollars, this is a positive signal. Conversely, if the cost per order exceeds the profit margin, you need to stop and optimize immediately.
Purchase Conversion Value
This metric tells you the total revenue that the ads bring in, which is not profit but the foundation for calculating ROAS. We often use this metric to compare directly with the amount spent to determine which campaigns are creating real value for the business.
ROAS
ROAS is a vital metric for sales advertisers. The formula is simple: revenue divided by ad spend. For example, if you spend 6,000 dollars and generate 28,240 dollars in revenue, your ROAS is 4.71. If your break-even point is only around 1.6 to 1.7, then this campaign is extremely profitable and can definitely be scaled. These first five metrics are the core set of metrics, so we always place them on the left to see them immediately without needing to scroll horizontally.
Reach, Impressions và Frequency
When scrolling to the right, we start looking at data according to the funnel structure. Reach indicates the number of unique users who have seen the ad. Impressions are the total number of times the ad was displayed. From these two metrics, you will have frequency, which is the average number of times each person sees the ad. For example, if reach is 164,000 people and Impressions are over 300,000 times, the frequency is about 1.8. This is a fairly safe level. If the frequency increases too high, the ad is at risk of fatigue, and you need new creatives.
CPM
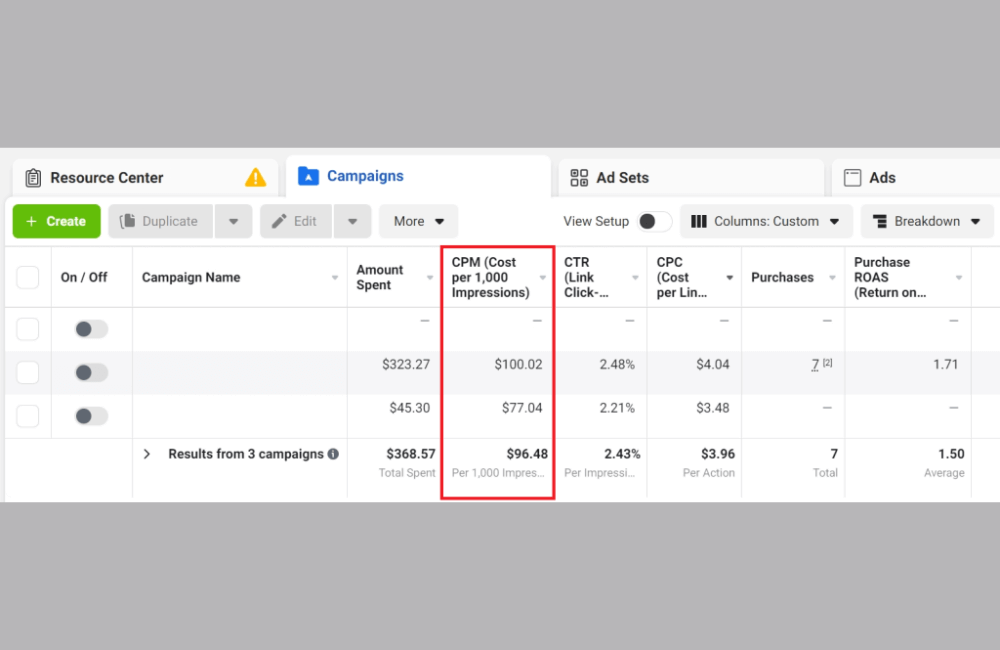
CPM reflects the market price you are paying to Meta. In the US market, a CPM of about 18 to 25 dollars is quite common. The goal is not the lowest CPM at all costs, but a reasonable CPM accompanied by quality traffic. A very low CPM is meaningless if people visiting the website do not make a purchase.
Cost per Unique Outbound Click
We prioritize this metric over regular cost per click. The reason is that a unique outbound click only counts unique clicks leading to the website, with each person counted only once. If this metric is under 1 dollar per click, it is a very good signal. It shows that your ad is attractive enough to pull users away from Facebook and onto the website.
Unique Outbound CTR
This CTR indicates what percentage of ad viewers clicked on the website link. This metric should be read alongside CPM to avoid misinterpreting the data. For many accounts we manage, a CTR of 3 to 5 percent is good, and over 6 percent is excellent. Most importantly, you must benchmark against your own account and avoid mechanical comparisons with others.
Hook Rate và Hold Rate
Hook Rate cho biết tỷ lệ người xem ít nhất 3 giây đầu video. Hold Rate cho biết bao nhiêu người tiếp tục xem video sau khi đã qua 3 giây đầu. Hai chỉ số này giúp chúng tôi đánh giá mức độ cuốn hút của creative. Tuy nhiên, thu hút đúng người mới là điều quan trọng, không phải chỉ thu hút thật nhiều lượt xem.
Add to Cart, Initiate Checkout và Purchases
We look at the steps in the funnel. For example, from adding to cart to initiate checkout, then to purchases. If you see an excessive drop-off rate, such as 6 people entering checkout but only 1 person purchasing, it is very likely that your website is facing issues such as prices being too high, unreasonable shipping fees, or a complicated checkout process.
AOV
AOV shows how much money each order brings in. The higher the AOV, the easier it is to achieve a good ROAS. If AOV is low, you can consider upselling, product bundling, or multi-buy offers to improve profits.
Effective Ad Management Tips for Facebook Advertisers
In our experience, mastering Facebook ad reporting tools significantly impacts ad measurement. Many new advertisers often keep the default Ads Manager interface and try to read everything Facebook displays. This not only fails to help but also causes data noise. For example, if you are running a purchase optimization campaign, metrics such as likes or comments carry almost no meaning in daily decision-making. Customizing columns helps you hide unnecessary data and highlight metrics that directly affect KPIs. As a result, it only takes a few minutes each day to know which campaigns are performing well and which ones need intervention. By default, the core group of metrics in Ads Manager includes:
- Budget
- Attribution setting
- Results
- Reach
- Cost per result
- Amount spent
How to edit and choose columns suitable for campaign goals
To edit the display columns, you simply need to click on the Columns menu in the top right corner of Ads Manager. Here, Facebook provides many presets corresponding to popular objectives.
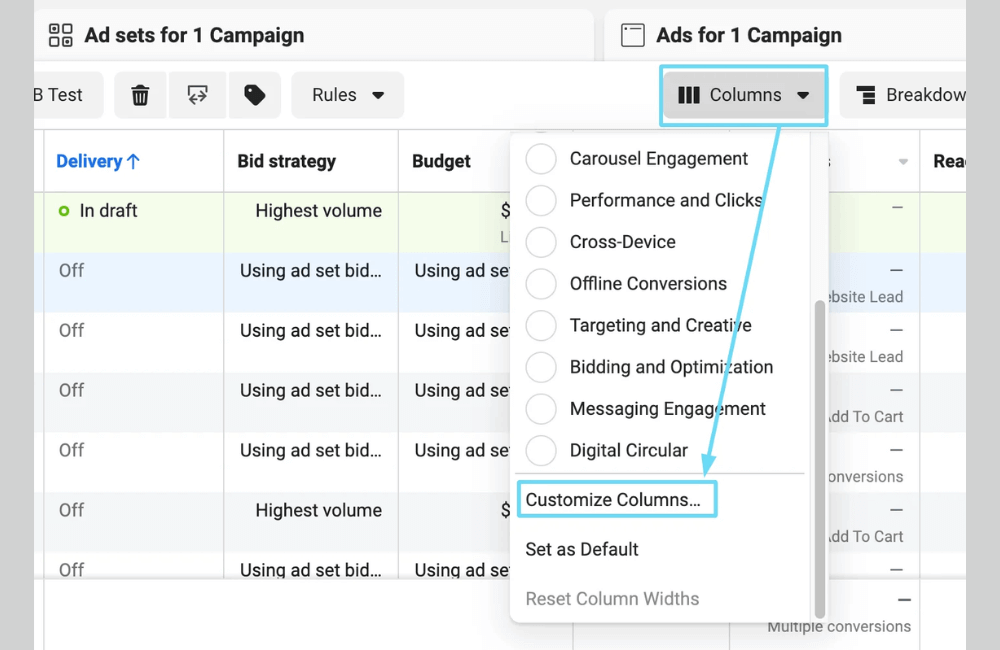
For example, if you are running a campaign to drive customers to an offline store, you can select the Offline conversions set. This set will display metrics such as offline purchases, offline leads, and cost per purchase. For retail advertisers with physical stores, this is an extremely valuable set of metrics to evaluate the actual effectiveness of the ads.
In case the presets do not meet your exact needs, we usually recommend that you create your own reports by selecting Customize columns. Here, you can search for and add any metrics you need, and rearrange the order according to your own data reading logic.
Save report settings for long-term use
A small but extremely useful tip that many advertisers overlook is saving the column configuration after customizing it. When you save a report as a preset, you can return to that set of metrics at any time with just one click.
For example, we often create presets such as “Purchase tracking”, “Quality lead tracking”, or “Creative testing”. Each preset serves a different purpose and helps save a lot of time when managing multiple ad accounts simultaneously.
Tracking the right key metrics not only helps you understand how your Facebook ads are performing, but is also the foundation for making accurate optimization decisions every day. When you focus on data that truly matters, you will avoid “emotional optimization”, control your budget well, and step-by-step improve ROI sustainably. Make measurement a habit, because data is the greatest advantage for every marketer in 2026.
Frequently asked questions
Not necessarily. You should focus on metrics directly linked to your current campaign goals, such as cost per result, ROAS, or conversion rate, instead of trying to track everything at once
When first running ads, you should prioritize tracking cost per result, conversion rate, and frequency to ensure ads are reaching the right people and not wasting budget.
💬 Contact now for free consultation from BHW!
- Website: https://vi.blackhatworld.io/
- Telegram: @bhw_agency
- Whatsapp: +84819001811
- Wechat: bhwagency
- Email: [email protected]
This article is also available in other languages: