How to Customize Your Facebook Ads Dashboard for Quick Performance Insights
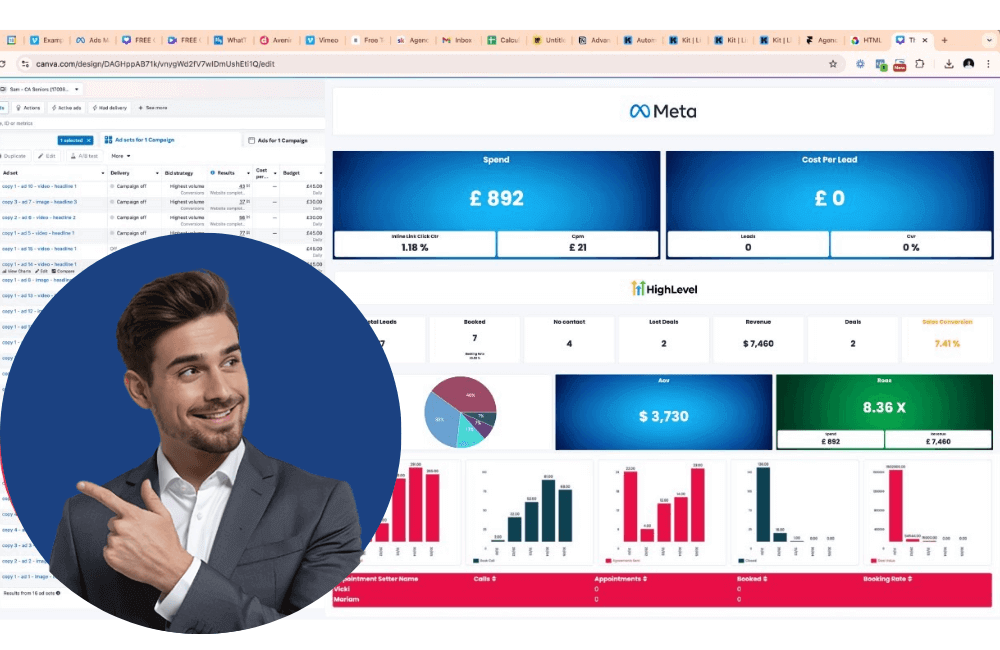
In the competitive world of Facebook advertising, monitoring campaign performance quickly and accurately is a crucial factor for timely decision-making and budget optimization. If you feel “lost in a sea of data” with dozens of reports, metrics, and data tables, then customizing the ads dashboard is the solution. With a smartly configured dashboard, we can immediately see key metrics such as CTR, CPC, ROI, or conversions without having to scroll through every campaign or detailed report.
In this article, BlackHatWorld will guide you step-by-step on how to customize the dashboard on Facebook Ads Manager, helping you easily access key information, focus on truly essential data, and make quick decisions to maximize campaign performance. Whether you are a beginner advertiser or an experienced one, these tips will help you work more efficiently and manage campaigns professionally.
Why is it necessary to customize the Facebook ad dashboard?
As you all know, every campaign has its own goals, from increasing brand awareness, generating leads, to optimizing conversions and revenue. A properly set up dashboard helps you focus immediately on key metrics, monitor real-time performance, and make quick decisions. Instead of spending hours compiling data from multiple campaigns, we can grasp ad effectiveness in just a few clicks, while precisely and efficiently optimizing the budget and creative strategy.
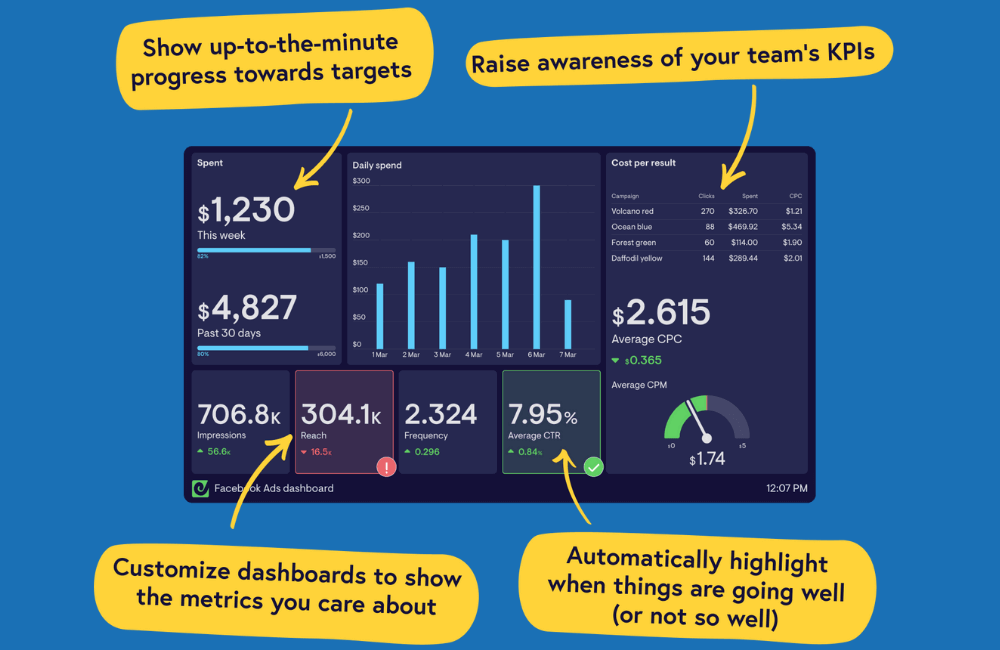
Accelerating decision-making with visual information
We and you all know that reaction time is a vital factor in ad management. When campaigns are running continuously, opening every detailed report to check performance can slow down the decision-making process. By customizing the Facebook ad dashboard, we can focus immediately on the most important metrics such as clicks, conversion rate, cost per action, and ROI. For example, if a campaign is performing poorly, you will see an alert right on the dashboard and can instantly adjust the budget or ad content without spending time searching through individual reports.
Focusing on key metrics for your business
Every business has its own goals, and this means we do not need to look at all the metrics simultaneously. A custom dashboard allows you and your team to display only the truly important metrics. For example, for online product advertisers, metrics like add-to-carts, conversion rate, and revenue from ads are more critical than impressions or post likes. Focusing on this data helps us make more precise and faster decisions, optimizing the advertising budget and enhancing campaign effectiveness.
Quick comparison and analysis between campaigns
When you run multiple campaigns concurrently, comparing the performance of each campaign can be confusing without a clear system. We often customize the dashboard to compare campaigns, ad sets, or individual ads in just a few clicks. For instance, you can compare two A/B testing campaigns on the same product to see which one yields a higher conversion rate. This allows us to quickly decide which campaign needs a budget increase, which one needs to be paused, or which one requires content adjustment.
Helping the advertising team work more efficiently
A custom dashboard is not only useful for managers but also helps the entire advertising team operate more smoothly. When all members have access to the data that we and you determine is important, everyone can easily understand campaign performance and the necessary steps to take. Furthermore, when you hire a Facebook ad campaign manager, they also need to set up an ad dashboard to quickly optimize performance.
Easy tracking and periodic reporting
We know that creating periodic reports can be time-consuming if data has to be compiled from multiple sources. With a custom dashboard, tracking and exporting reports become faster and more accurate. For example, you can set up a dashboard to display revenue by day, week, or month along with advertising costs, conversion rates, and other ROI metrics. As a result, both we and you not only save time but also ensure data is transparent, easy to understand, and serves for continuous campaign optimization.
Key metrics you need to consider adding to the Facebook ads dashboard
To maximize campaign effectiveness, both we and you need to ensure that the Facebook ads dashboard fully displays key metrics. These metrics help you quickly assess performance and make timely decisions. Below are the metrics we always prioritize adding to the dashboard when managing client accounts.
Purchase ROAS
This is the top-tier key metric that we track. For example, if you sell products online, enter “purchase” and add “purchases” and “value” to see how much customers actually spend on each order. This metric allows us to evaluate the true ROI and decide whether to increase or decrease the budget for a specific campaign.
CPM
CPM is an essential metric for analyzing ad cost effectiveness. We and you can use CPM to compare costs between campaigns, especially when optimizing for traffic, brand awareness, or conversions. A high CPM may signal that the ad has reached many people but requires content or retargeting optimization.
Outbound Clicks and Outbound Click-Through Rate
When running direct sales campaigns on a website, the outbound clicks metric becomes extremely important. An outbound click differs from a normal click because it only counts clicks that take users off the Meta platform, such as Facebook or Instagram. If your campaign directs to an external landing page, this is the main metric for evaluating the actual traffic from the ad.
Link Clicks and Link Click-Through Rate
For Facebook leads or Facebook purchase campaigns, we often include link clicks to know the number of people who actually clicked on buttons like “learn more,” “shop now,” or “get a quote.” Combined with the link click-through rate, you will be able to assess the effectiveness of the ad creative and its potential to attract leads.
Video Hook Rate and Video Hold Rate
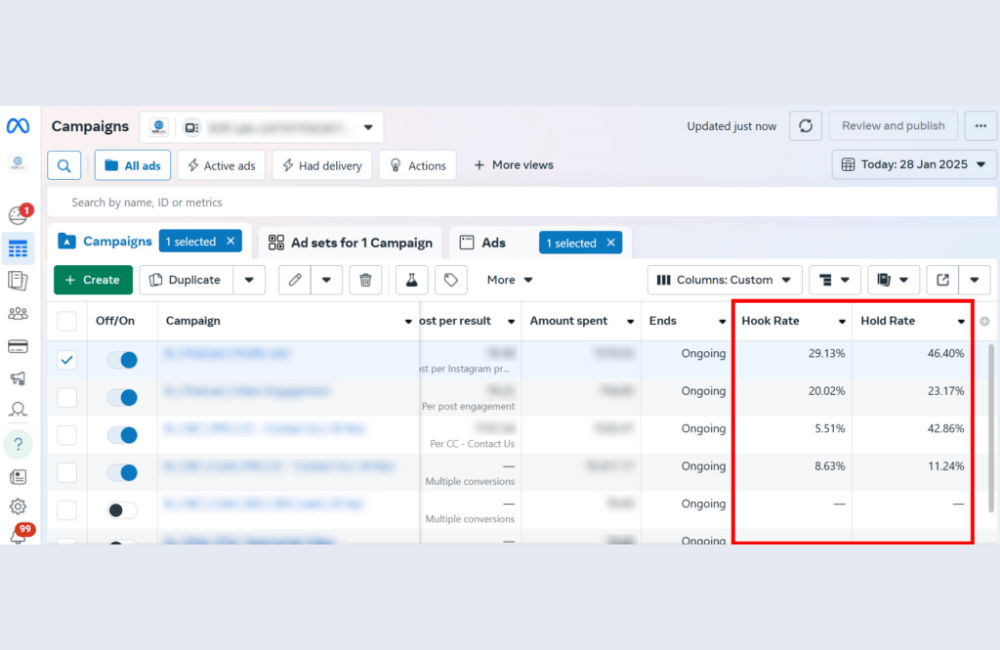
Videos are increasingly becoming the preferred format on Facebook and Instagram. We always encourage you to use at least one creative that is a video. Video Hook Rate measures the effectiveness of the first 3 seconds of the video, which is the most critical time to retain viewers. Formula: Number of 3-second video views / Impressions, expressed as a percentage (%). Video Hold Rate measures the number of full video views divided by impressions, helping you evaluate viewer retention capability. Comparing two videos, the one with a higher hook rate usually also has a higher hold rate, meaning the ad is more effective.
Frequency
Frequency is the number of times each person sees the ad. We recommend that you maintain a frequency between 2 and 3 times to avoid viewer fatigue. If the frequency is too high, users may feel annoyed, reducing the campaign’s effectiveness.
Reach and Impressions
Reach is the number of unique people exposed to the ad, while impressions calculate the total number of times the ad is displayed. These metrics help us evaluate the actual scale of reach and optimize the budget effectively.
Cost per Result and Amount Spent
These metrics provide information on the cost per result and total spending. We use them to compare campaigns and decide which campaigns need further optimization or scaling.
Purchase Conversion Value and Website Purchase Conversion
Purchase conversion value helps you track the total conversion value, including customers who buy multiple products. Website purchase conversion separates purchases on the website and purchases on Facebook/Instagram Shop, helping you determine which channel is the most effective.
After the iOS 14 privacy updates, the data reported to Facebook is not always 100% accurate. We recommend using the conversion API, testing conversion events, and combining this with analytics tools such as Google Analytics, Highrows, Triple Whale, or Northbeam to improve accuracy and ensure campaigns are optimized using real data.
How to Customize Your Facebook Ads Dashboard for Quick Performance Insights
A customized dashboard helps advertisers master the Facebook ad reporting tool, detect issues promptly, and optimize campaigns immediately. Instead of being overwhelmed with dozens of unnecessary metrics, you can select only the most critical information relevant to your goals.
Open Business Manager and access the dashboard
You open Business Manager and start from the Facebook ads dashboard. This is where you can visually monitor campaign performance. When you enter the dashboard, you will see the three horizontal bars icon in the upper corner. Click on this icon, and the default dashboard will appear with standard metrics such as end date, results, reach, impressions, and cost per result.
Customize columns according to your needs.
For the dashboard to display only the key metrics, we need to click Customize Columns. Then, a list of columns appears, allowing you to select the information you wish to track. For example, we often use the shortcut: select all, then deselect all, only leaving the 7 important columns.
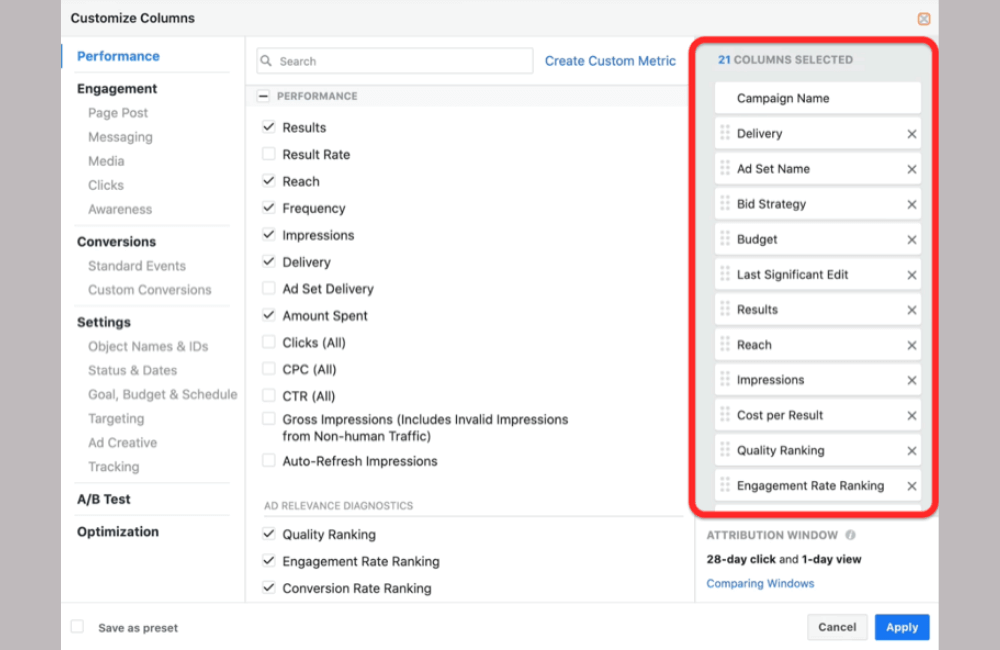
We recommend you keep the campaign name displayed first and press Apply. Now, your dashboard is tidy, only showing the metrics you need to start building an optimization strategy. If you are running a traffic campaign, the metrics you need to track are:
- Click-through rate
- Cost per landing page view
- Total landing page views
If you are running an e-commerce store, you should also add:
- Add-to-cart value
- Cost per add to cart
Specific examples for an e-commerce campaign:
- Click-through rate
- Cost per landing page view
- Number of landing page views
- Add to cart
- Website adds to cart
Saving the customized dashboard
After selecting the metrics, we recommend you save the dashboard by pressing Set as Default, naming it a Customized Dashboard, and pressing OK. Now, you have a customized dashboard ready for use in subsequent campaigns.
Adjustments for video campaigns
If you are running a video view-based campaign, you can adjust the dashboard as follows:
- Remove the current columns
- Add the video plays at 50%, 75%, 95% columns
- Add cost per through play
- Add post engagement if you are running a branding campaign
You can also drag the columns to change the display order. For example, we usually prioritize the amount spent and cost per result at the beginning, followed by video views, and keep other metrics unchanged. When the data is displayed, you will see:
- Results
- Number of video views
- Cost
- Engagement level
We recommend you only select the most important metrics relevant to your campaign goals. For example, if selling a product, the metrics to add include:
- Purchase return on ad spend (ROAS)
- Number of leads generated
- Number of purchases
- Cost per purchase hàng (Cost per Purchase)
Creating multiple dashboards for multiple objectives
After completing the setup, click save, and name the dashboard e-commerce dashboard. Now, you can switch between the customized dashboard and the e-commerce dashboard to monitor different metrics relevant to each campaign objective. This helps us manage data visually, quickly, and optimize Facebook ad performance more effectively.
Customizing the Facebook ad dashboard helps advertisers like us easily track key metrics, optimize campaigns promptly, and enhance ROI efficiency. By selecting data that aligns with business goals, you will manage ads more effectively and make decisions based on real-time data instead of gut feeling.
Frequently asked questions
Yes, you can absolutely save multiple customized dashboards for various campaign types. For example, you can create one dashboard for traffic campaigns, one for e-commerce campaigns, and another for branding campaigns. Each dashboard will store the metrics relevant to the specific objective, and you can switch between these dashboards quickly in the Ads Manager.
To change the displayed metrics without losing the current settings, you simply need to create a duplicate of the existing dashboard and then make the edits on that duplicate. Alternatively, you can save the original dashboard with a different name before adding or removing new columns, ensuring that the original remains with its initial settings.
💬 Contact now for free consultation from BHW!
- Website: https://vi.blackhatworld.io/
- Telegram: @bhw_agency
- Whatsapp: +84819001811
- Wechat: bhwagency
- Email: [email protected]
This article is also available in other languages: